 |
Log Graphs | |
|
[ SciRep | Graphing | Software | Glossary ] There are times when we don't just want to plot one set of data against another. Instead, we realise that there exists a certain relationship between the variables, and want to know what it is. For example, let us deal with the length, l of an oscillating beam, and its period, T of oscillation. Assume that they are related to each other as follows: T = kln, where k and n are unknown constants, not necessarily integers. How do we go about finding what k and n are using a graph? I am assuming that you have a basic knowledge of what logs are, and don't consider them to grow on trees. Fullick (p. 39) has a section if you're not au fait. Take logs of both sides of the equation:
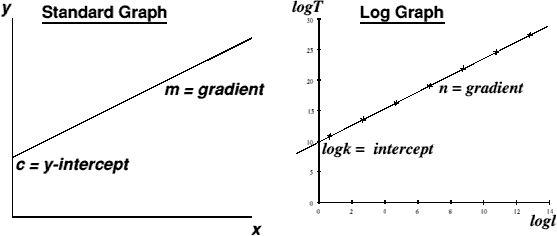
log T = log k + log ln log T = log k + n log l Compare this to the standard way of looking at an x-y graph, i.e. y = mx + c, and we find the following direct comparisons:
m = n, c = log k Hence, a graph of logT against logl will yield a straight-line relationship, gradient n and y-intercept logk.
Thus any physical quantities that appear to have a power relationship between them can have a formula derived directly from the logs of the data! The other advantage of plotting a log graph is that you are, within experimental uncertainty, guaranteed a straight line - hence it is an easy matter to plot it by hand if you do not have access to a computer to plot the graphs on. For further information on better graph plotting, and help with coursework report writing in general, see the rest of the SciRep series. Last updated Tuesday 20th February 2001 | ||
